Data analytics is the process of examining, cleaning, and modeling data to discover useful information, draw conclusions, and support decision-making. It involves using various tools and techniques to analyze data sets, identify patterns and trends, and gain insights that help businesses understand their operations, improve efficiency, and make informed decisions. Essentially, data analytics turns raw data into meaningful information that can drive better business outcomes. Up to 84% of businesses are investing in big data and artificial intelligence to enhance their business agility. This highlights the growing importance that companies are placing on data-driven decision-making.
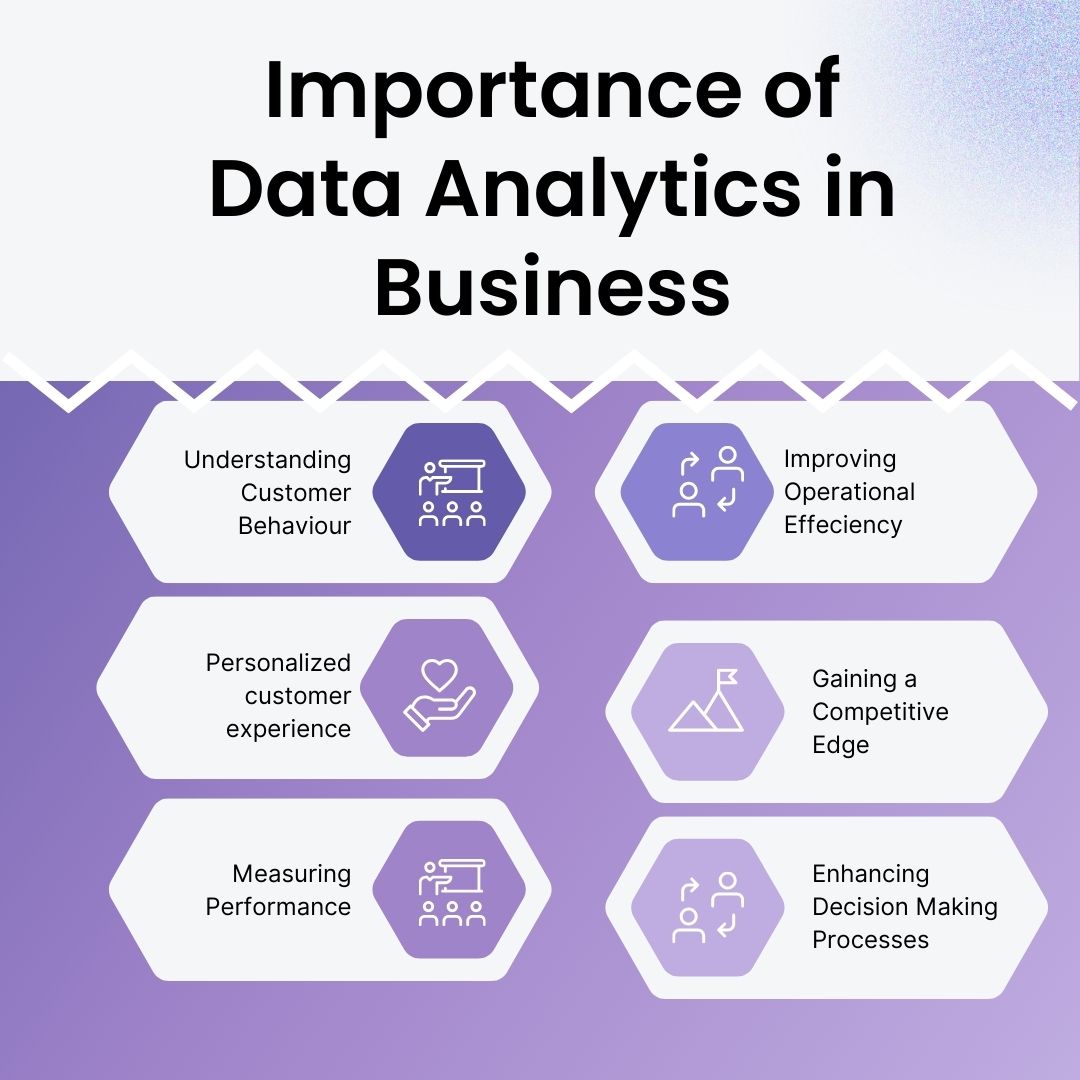
Importance of Data Analytics in Business
Data analytics helps businesses understand their customers better. By analyzing data from various sources, companies can identify trends and preferences, allowing them to tailor products and services to meet customer needs more effectively. This results in happier customers who stay loyal to the brand.
Improving Operational Efficiency
Through data analytics, businesses can streamline their operations. By examining data on processes and workflows, companies can identify bottlenecks and inefficiencies, making it possible to implement improvements. This results in cost savings and more efficient use of resources.
Gaining a Competitive Edge
Data analytics provides businesses with a competitive edge. By analyzing market trends and competitor data, companies can make informed decisions that keep them ahead of the competition. This proactive approach helps businesses anticipate changes and adapt quickly, ensuring they remain relevant in a fast-paced market.
Turning Data into Actionable Insights
Data analytics transforms raw data into actionable insights. These insights inform strategic decisions, from marketing campaigns to product development, ensuring that business strategies are data-driven and aligned with real-world trends.
Driving Better Business Outcomes
Ultimately, the use of data analytics leads to better business outcomes. Whether it’s increasing sales, improving customer satisfaction, or enhancing operational efficiency, data-driven decisions result in measurable improvements that contribute to the overall success of the business.
Personalizing Customer Experience
By using data analytics, businesses can craft unique and personalized experiences that truly resonate with their customers. By understanding individual preferences and behaviors, companies can offer customized recommendations and services, enhancing the customer experience and fostering long-term relationships.
Enhancing Decision-Making Processes
Data analytics supports better decision-making by providing a solid foundation of evidence. It reduces the reliance on intuition or guesswork, allowing businesses to make more accurate and reliable decisions that are backed by data.
Predicting Future Trends
Predictive analytics, a branch of data analytics, helps businesses forecast future trends. By analyzing historical data, companies can predict market shifts, customer behaviors, and other critical factors, enabling them to prepare and strategize accordingly.
Measuring Performance
Data analytics allows businesses to measure performance accurately. By setting key performance indicators (KPIs) and tracking them through analytics, companies can monitor their progress, identify areas for improvement, and celebrate successes.
Supporting Innovation
Lastly, data analytics fosters innovation. By providing insights into what works and what doesn’t, businesses can experiment with new ideas, products, and strategies with confidence, knowing they have data to guide their innovations.
Types of Data Analytics for Business
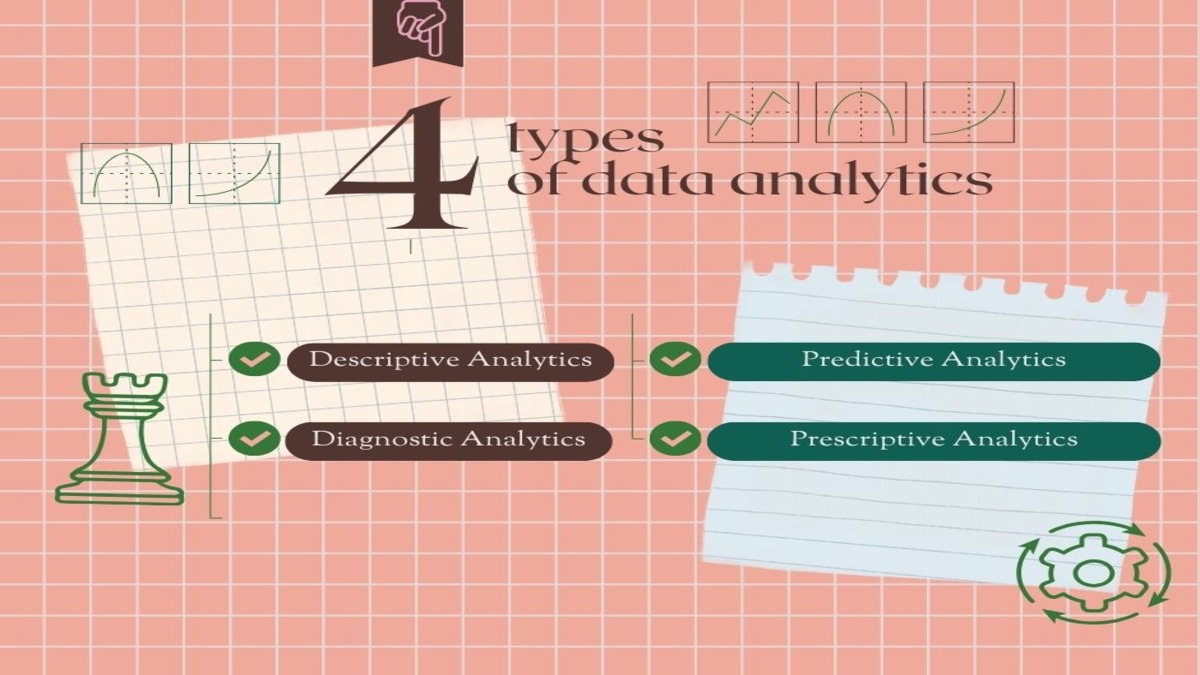
Data analytics is crucial for businesses to make informed decisions. Each type of data analytics provides unique insights and helps businesses make better decisions by understanding past events, diagnosing causes, predicting future trends, and prescribing actions for optimal results. Here are the four main types:
1. Descriptive Analytics
2. Diagnostic Analytics
Diagnostic analytics looks into why past events happened. It uses methods like drill-down analysis, data exploration, and finding correlations to discover the reasons behind trends and outcomes. For instance, analyzing why sales dropped during a particular quarter.
3. Predictive Analytics
Predictive analytics taps into the power of statistics and machine learning to forecast future events by looking at patterns in past data. This helps businesses see trends ahead of time and make smart, proactive choices.Examples include demand forecasting and risk assessment.
4. Prescriptive Analytics
Prescriptive analytics tells you what actions to take to achieve your goals. It combines predictions from past data with decision-making models to recommend the best steps forward. This way, it helps you choose the right path to reach your desired outcomes. For example, recommending inventory levels based on predicted sales trends.
Steps to Implement Data Analytics
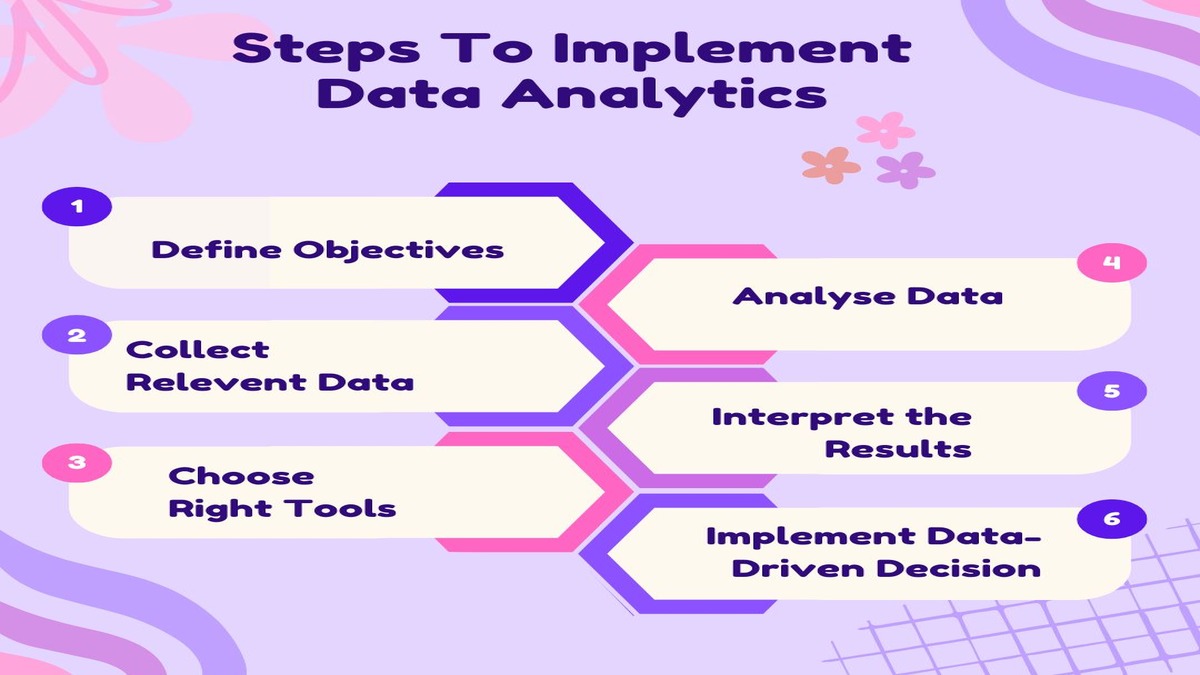
Step 1: Define Your Objectives
Step 2: Collect Relevant Data
Gather data that is relevant to your objectives. This could include customer data, sales data, market trends, and more. Ensure the data is accurate and up-to-date.
Step 3: Choose the Right Tools
Select the appropriate data analytics tools to analyze your data. Tools like Google Analytics, Tableau, and Microsoft Power BI are popular choices for their robust features and user-friendly interfaces.
Step 4: Analyze the Data
Use your chosen tools to analyze the data. Look for patterns, trends, and insights that can help you understand your business better. Data visualization techniques can help present the data in an understandable way.
Step 5: Interpret the Results
Interpret the results of your analysis to make informed decisions. Consider how the insights align with your business objectives and what actions you can take based on these insights.
Step 6: Implement Data-Driven Decisions
Use the insights gained from data analytics to implement changes and make decisions. Monitor the outcomes to see if they align with your expectations and adjust your strategies as needed.
Benefits of Using Data Analytics
- Improved Decision-Making: Data analytics provides factual insights that support better decision-making, reducing the reliance on gut feelings or assumptions.
- Enhanced Customer Insights: Understanding customer behavior and preferences helps in creating personalized experiences, leading to higher customer satisfaction and loyalty.
- Increased Efficiency: Identifying bottlenecks and inefficiencies through data analytics can help streamline operations and reduce costs.
- Competitive Advantage: Businesses that leverage data analytics can stay ahead of the competition by quickly adapting to market changes and customer needs.
Challenges in Data Analytics
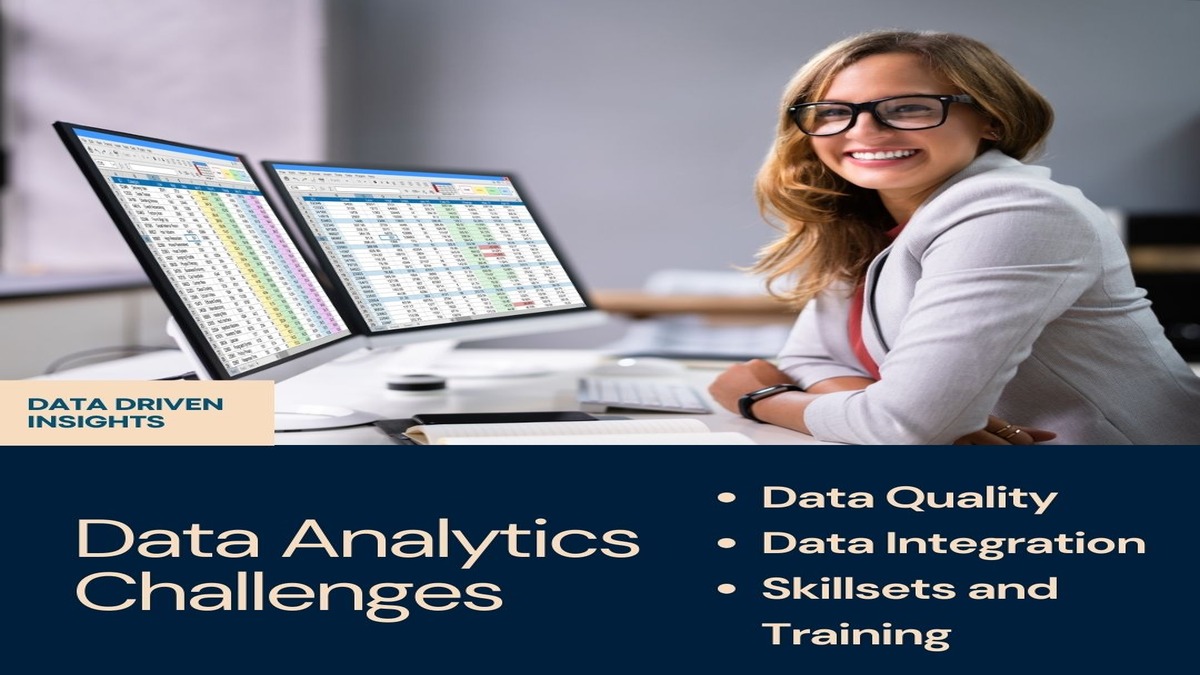
- Data Quality: When data quality is poor, it can result in misleading insights and bad decisions.
- Data Integration: Combining data from various sources can be challenging. Use data integration tools and techniques to ensure a cohesive dataset.
- Skillset and Training: Having skilled personnel who can effectively use data analytics tools and interpret results is essential. Invest in training and development.
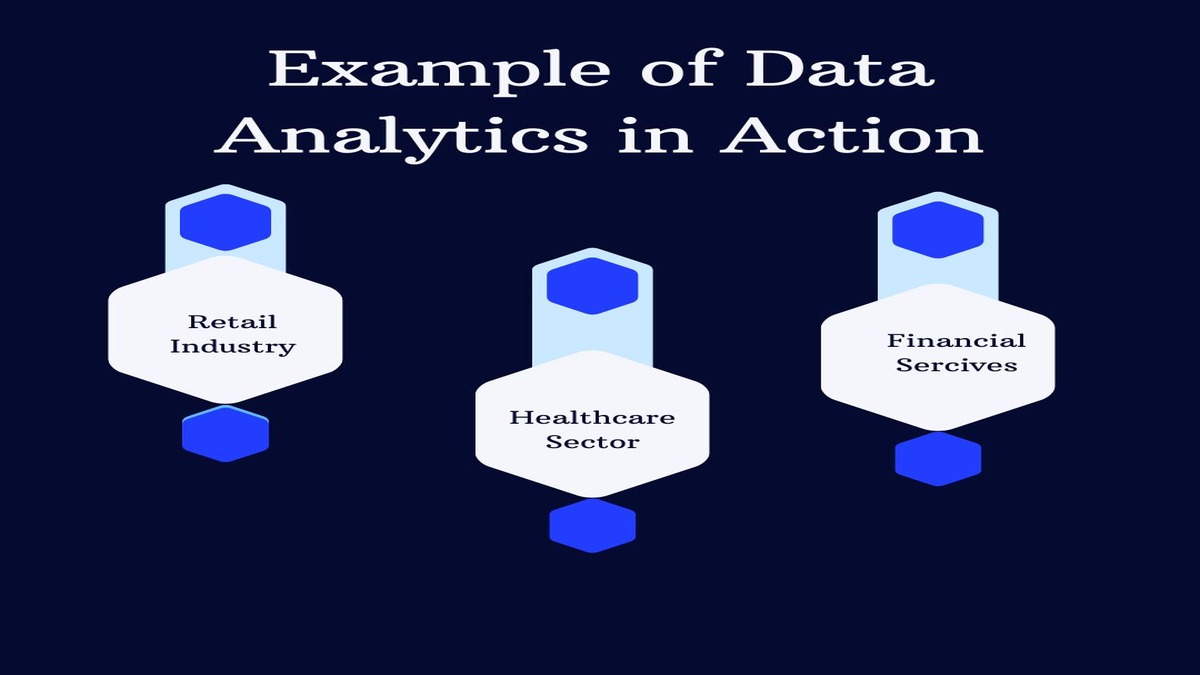
Examples of Data Analytics in Action
Retail Industry
A retail company used data analytics to optimize its inventory management. By analyzing sales data and customer preferences, they were able to reduce stockouts and overstock situations, leading to higher sales and customer satisfaction.
Healthcare Sector
A healthcare provider started using data analytics to enhance the quality of patient care. By analyzing patient data, they identified trends and patterns that helped in early diagnosis and personalized treatment plans, improving patient outcomes.
Financial Services
A financial institution used data analytics to detect fraudulent activities. By analyzing transaction data, they identified unusual patterns and prevented significant financial losses.
Conclusion
Using data analytics to drive business decisions is essential in today’s data-driven world. By defining clear objectives, collecting relevant data, using the right tools, and interpreting the results, businesses can make informed decisions that lead to better outcomes. Embrace data analytics to stay competitive and drive growth in your business.
Top 10 FAQs on Using Data Analytics to Drive Business Decisions
Q1: What is data analytics?
Ans.Data analytics is the process of examining raw data to uncover patterns, draw conclusions, and inform decision-making using various tools and techniques.
Q2: Why is data analytics important for business decisions?
Ans.Data analytics provides insights based on factual data, helping businesses understand trends, improve operations, and make informed decisions that enhance performance and competitiveness.
Q3: How do I start using data analytics in my business?
Ans.Begin by defining clear objectives, collecting relevant data, choosing appropriate analytics tools, analyzing the data, interpreting the results, and implementing data-driven strategies.
Q4: What tools can I use for data analytics?
Ans.Common tools include Google Analytics, Tableau, Microsoft Power BI, and IBM Watson Analytics, which offer features for data visualization, reporting, and analysis.
Q5: How can data analytics improve decision-making?
Ans.By providing objective insights from data, analytics helps reduce reliance on assumptions, allowing for more accurate and effective decision-making.
Q6: What are some common challenges in data analytics?
Ans.Challenges include ensuring data quality, integrating data from multiple sources, and having skilled personnel to use analytics tools and interpret data accurately.
Q7: How can data analytics enhance customer insights?
Ans.Data analytics helps businesses understand customer behavior and preferences, enabling them to create personalized experiences and improve customer satisfaction and retention.
Q8: Can data analytics help in detecting fraud?
Ans.Yes, data analytics can identify unusual patterns and anomalies in transaction data, helping detect and prevent fraudulent activities.
Q9: What role does data visualization play in data analytics?
Ans.Data visualization presents data in graphical formats, making it easier to understand complex information, identify trends, and communicate insights effectively.
Q10: How can I ensure data quality in my analytics efforts?
Ans.To ensure data quality, regularly clean and validate your data, use reliable sources, and implement robust data governance practices to maintain accuracy and reliability in your analysis.
Read More: How to Use Social Media for Marketing

